How can we seize the opportunity for metrics magic as designers?
User experience metrics can be leveraged to not just build better products, but also to gain organizational buy-in for the work UX teams do.
When we correlate certain qualitative goals with a quantifiable outcome, metrics can address common challenges and build buy-in for the value of UX.
Metrics can help you create a story around the impact and value UX brings to a cross-functional team, and they present opportunities to quantify that impact. This can be very compelling to stakeholders across disciplines.
Common Challenges for UX Teams
It’s not unusual to see resistance within an organization to integrating a new UX team or fully embracing what UX capabilities. At a networking event, I spoke with a group of tech leaders from finance, ecommerce, and fashion about some of the obstacles we’ve seen UX designers face. Some themes from our discussion emerged:
- Design is additive, it rarely happens on its own in a business environment. Design without specific functionality is also known as art. This presents two problems for UX teams: the perception that it would be fine to create products without design and the challenge of directly attributing product success to good design.
- UX design is focused on users at the end of the consumption chain, whereas a lot of traditional business KPIs are more closely connected to customers or organizations. In B2B applications, the concept of a customer (like Nike) and a user (like Jennifer) are rarely the same entity. This makes it hard for UX to demonstrate impact, because your results are pointing to something different.
- People often like to say that “design is a process, and it’s never really done.” That’s not the most inspiring way to think about the work; how do you know when you’re done enough? How do you know what to go back to and how to prioritize your time? When design starts to feel like a riddle or a never-ending puzzle in people’s minds, they might not want to participate anymore.
- UX work, at first glance, is not easily quantifiable. We emphasize things like confidence, satisfaction, happiness. Those are subjective concepts that can be really tough to assign numbers to.
Thankfully, when we have a way to correlate certain qualitative goals with a quantifiable outcome, metrics can address common challenges and build buy-in for the value of UX. Good UX leads to better products and better relationships with users and customers, so it’s key to get your organization excited about your work.
The two tools I’ll highlight here have been valuable to me as a UX leader at an engineering-driven organization, but they can be useful in many contexts.
Quantifying Usability with PURE
The first approach to metrics I want to share is called PURE: Pragmatic Usability Rating by Experts. Developed by Christian Rohrer of Nielsen Norman Group, PURE provides a “usability evaluation that quantifies how difficult a product is to use, and provides qualitative insights into how to fix it.” Here’s an overview of how to conduct a PURE evaluation:
Internal Evaluation That Follows an End-to-End Task Flow
- Assume a persona and task
- Team goes through pre-identified steps to complete task
- Score each task 1-3 in terms of difficulty
- Discuss as a group how it went and any major score discrepancies
- Mark steps you believe could have a “quick fix” to improve ease of use
To conduct a PURE evaluation, gather a team of people who are familiar with both the product or feature you’re evaluating and the fundamentals of usability and human computer interaction. For example, I’ve assembled UX designers, product managers and engineers curious about the process.
Beforehand, determine what task flow you’d like to evaluate. Break the task down into the steps required to complete it.
When you start the evaluation, ask everyone to assume a relevant persona. They’ll put themselves in the shoes of a person who would actually complete this task. As a group, go through each step in the task and give the steps a 1-3 ranking in terms of difficulty.
The initial scoring is individual work. Then, have a discussion to see how everyone ranked the steps within the task. If there are any major discrepancies, talk about why or how they came to their scoring decisions. Finally, with this end-to-end flow in mind, start to discuss opportunities for quick fixes or iterations that would address identified pain points. It might also turn out that there aren’t quick fixes available and a larger project should be included in future roadmap or prioritization discussions.
The PURE Scoring Rubric
The ranking system you’ll use in a PURE evaluation is a subjective rating scale based on these guidelines:
- Can be accomplished easily by a target user with low cognitive load. Leverages known patterns.
- Requires notable degree of cognitive load, but can generally be accomplished with some effort.
- Difficult due to significant cognitive load, physical effort, or confusion. Some target users would likely abandon the task.
This rubric demonstrates why it’s important to take advantage of your personas whenever you can. The score will differ through the lens of a first-time user versus an expert. This can lead to productive conversations about for whom you want to optimize. The scoring is subjective, and in my view, the numbers matter a little less than the conversations the activity generates.
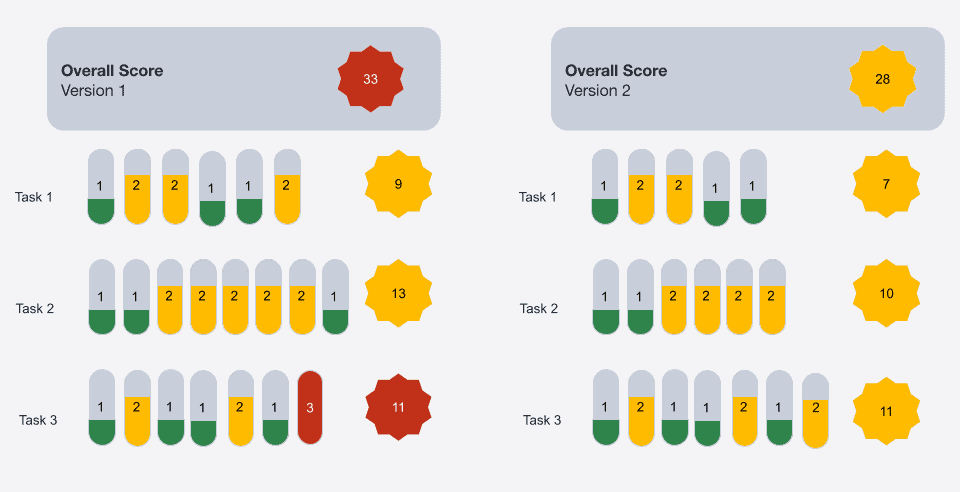
Here’s an example of a scorecard:
There’s no ideal number you want to hit in a PURE evaluation. Once you’ve established your baselines, your goal is to decrease the number.
Let’s say you’ve finished your initial evaluation of a product feature, the team has created a list of quick fixes to iterate on and improve, and then there’s another release the following quarter. At that point, you (or whoever from the UX team led the first session) should identify the steps required for your target persona to complete the task and facilitate another evaluation using the same tasks. The team will follow the same process.
There are two ways you might see the score decrease. Numbers assigned to a step could go down, or the total number of steps within a task could go down. This depends on what the team decided to work on as a result of the initial evaluation.
You can continue using this format for as long as you iterate on a feature. From time to time, as things get released, you might introduce some unintended friction into a process. Regular PURE evaluations can help you see when that happens and support continuous iteration for as long as needed.
Example: Using PURE with a Sprint Team
In a previous role, my team shifted our product strategy away from selling apps to focus instead on providing a platform comprising many integrated experiences. In order to execute on that vision we needed to improve our global navigation. Rather than trying to jump in, we wanted to start with incremental improvements over time—less disruptive to our users.
We got a team together and did an initial PURE evaluation to establish a baseline. This helped us generate an initial list of iterations that we could prioritize to get started. It also identified some of the bigger efforts that we would eventually need to address.
The activity itself was also valuable as a shared experience for the project team and helped align everyone’s understanding of the current state. By talking through the existing friction points with engineers at this early stage, the designers built understanding of some of the important technical and feasibility issues. The engineers got a chance to understand more about the target users and spend an afternoon purposefully putting themselves in those users’ shoes. It was the ideal activity to kick off a huge initiative.
Creating Success Metrics with HEART
The HEART model originated from Google. Tomer Sharon, a thought leader who has led UX at Google, says HEART allows you to choose and define appropriate metrics that reflect both the quality of your user experience and the goals of your product. You can use it to create success metrics for the work you release to your customers and users. It gives you concrete things to watch so you can determine whether a feature is performing as hoped.
The acronym categorizes user experience into five areas:
- Happiness: Users have a positive view of the app or feature
- Engagement: Users get the full intended value through depth of experience
- Adoption: New users engage with a feature
- Retention: Users regularly come back and use the feature
- Task Success: Users successfully complete the task a feature is designed to address
Happiness: You might provide a quick in-app survey to users who have engaged with a feature that asks about their satisfaction with the experience or their confidence that they did it right. In the world of B2B software, I like to use confidence as an indicator of happiness. It’s a little unrealistic to expect that the tools you use at work will spark joy more than once in a blue moon. However, confidence in a job well done is the kind of feeling that we should try and give our users every time we can.
Engagement: This is a way to think about the depth of experience you provide. Say you have multiple touchpoints wrapped into a single concept. You might want to know how many users are interacting with all of the component parts, how often each of those parts is a starting point, or how frequently certain parts are used together. Depth of use is the key to engagement.
Adoption: Adoption is pretty straightforward. How many people, either in percentage or numbers, use what you’ve released? It’s useful to timebox this metric and look at something like the number of people who use a feature within the first 90 days of release.
Retention: This is all about return users. It helps you see whether something is valuable enough that people will come back and use it again once they’ve discovered it.
Task Success: Are your users able to complete the task as you envisioned it?
Using HEART as a Team
Working together to determine user-centered success metrics for a project is another great way to build team alignment around expected outcomes. It addresses the concern that design is never done by establishing a definition of “done” from the start, and it creates alignment on “success” of the feature. If metrics are not reached, then the team is ready to iterate and improve them without debate.
Not every project will necessarily have a metric for each category, but consistently using the HEART model pushes teams to think through multiple ways of understanding their users’ experience.
HEART conversations can also help identify gaps in your data. In order to successfully measure task success, you need to capture and log various events in your app. Data and analytics teams can find value in HEART conversations because it helps them be proactive and understand what needs to be captured.
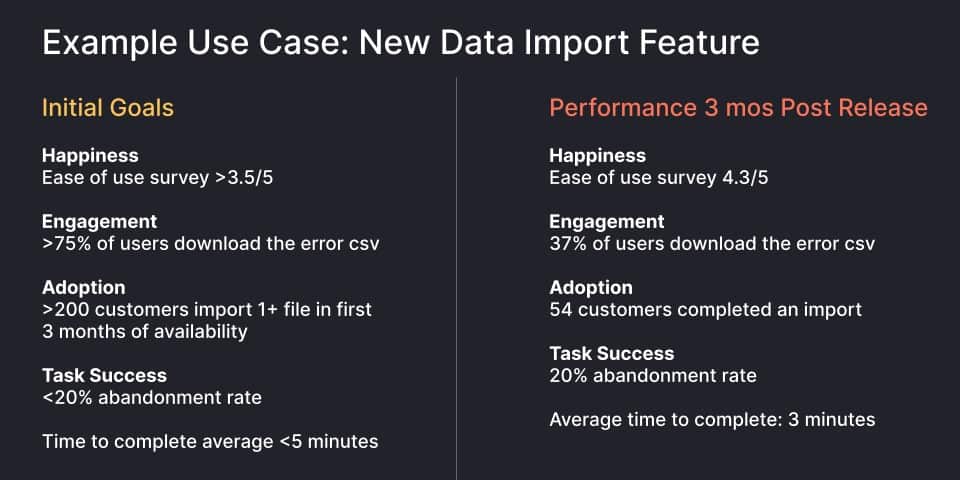
Here’s an example of how I’ve used HEART to define what success would look like on a data import feature: the initial goals that the team identified and here’s how the metrics looked three months after release
We were able to make quick prioritization decisions and easily identify areas that we wanted to work on more. Engagement and adoption were clear areas to pay attention to.
UX teams can find many opportunities to incorporate PURE and HEART into their work. Leveraging these tools will help you build bridges between UX, product and engineering through the magic of metrics.
* * *
Looking to understand traditional business KPIs, strengthen alignment with cross-functional partners and develop the right metrics for the value of your design work? Enroll in Pragmatic Institute’s Business Strategy & Design course.
Author
-

Leah Ujda, a visionary in human-centered design leadership with 24 years of experience, has left an indelible mark at institutions like The Art Institute of Chicago, University of Wisconsin, and Indeed.com. Her impactful contributions extend to roles at Wisconsin National Primate Research Center, Madison College, Design Concepts, Widen, and Grafana Labs. For questions or inquiries, please contact [email protected].
View all posts


