
In a world of fierce competition, designing products and services that meet users’ needs is the key to standing out in the crowded digital landscape.
This article dives into the world of data-driven design, the types of data that inform user experience design decisions, and how to effectively collect, analyze and implement data-driven insights.
We will also discuss the challenges and pitfalls associated with data-driven design and highlight the success stories of companies embracing this approach to create exceptional user experiences.
Why Does Data-Driven Design Matter?
At its core, the data-driven design process entails collecting and analyzing user data and incorporating it into the design process. This methodology enhances the user experience by grounding design decisions in real-world user needs and behaviors.
The Role of data in the UX design process
Data plays a crucial role in helping UX designers understand user preferences, pain points and requirements. Armed with this information, designers can fashion bespoke solutions, finely tuned to the exact needs of their users.
Data also enables designers to evaluate the effectiveness of their design choices by measuring user engagement, satisfaction and conversions. This feedback loop allows for ongoing refinements and adjustments to continuously optimize the user experience.
Success Stories of Data-Driven Design
Data-driven design has helped numerous leading companies improve user experience and achieve better results.
Airbnb
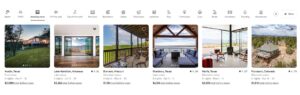
Airbnb’s data-driven design has been instrumental in improving the user experience through flexible destinations. By analyzing user data, Airbnb discovered that people prioritize finding unique places to stay over a specific destination. This led to the Flexible Destinations feature, which adapts to the user’s location and surfaces unique properties in places they may not have considered.
Airbnb has used data to identify the unique properties users are most interested in, such as ryokans in Japan, trullos in Italy or castles in Spain. They have also used data to identify the specific attributes that users value, such as ocean views or gas vs. wood-burning fireplaces.
To further improve the user experience, Airbnb has improved its search capabilities by adding new filters that adapt to the season or location and allow users to search for homes near points of interest. This data-driven approach has made it easier for users to find their ideal place to stay.
Slack
Slack implemented a data-driven design approach to address the challenge of complexity as the platform grew in size. They assembled a small team of designers, engineers, researchers and product managers to create prototypes.
They stripped away as much of the interface as possible, reorganized it piece by piece, and came up with intriguing but untested prototypes.
To ensure the prototypes were better, Slack brought in customers for feedback. The team worked with around 100 users from organizations worldwide. The feedback provided the team with insights, namely, the importance of “obvious over clever” design.
Slack’s research team ran another study that compared the old Slack experience against the new one. For each version, they asked people who had never used Slack to complete a few essential tasks, like conducting a search in the app or sending a message.
Slack’s data-driven design approach resulted in a significant update to the platform’s design. The update to Slack’s design consisted of several changes, including adding new features like channel sections, repositioning existing elements, and revamping the information architecture to simplify the user experience.
Collecting Data for Design
Both quantitative and qualitative data are invaluable in understanding user needs, behaviors and preferences. By combining these two complementary data types, UX designers can comprehensively understand users and create experiences tailored to their needs.
Quantitative data
Quantitative data provides numerical information that can be measured and analyzed statistically. This data offers valuable insights into user behavior, engagement and preferences, helping designers identify patterns and trends.
Some common sources of quantitative data include:
- Analytics and metrics from tools, such as Google Analytics, provide a wealth of information on user behavior, including metrics like page views, bounce rates, conversion rates and session durations.
- A/B testing, or split testing, compares two versions of a design element (e.g., button color, call-to-action text) to determine which performs better.
- User surveys are a valuable tool for collecting quantitative data on user preferences, needs and satisfaction levels. By asking users to rate their experiences or answer specific questions, designers can gain insights into what users value and expect from a product or service.
Qualitative data
Qualitative data provides in-depth, non-numerical insights into user behavior, motivations, and emotions. This data type helps designers empathize with users, understand their needs and create more engaging and intuitive experiences.
Some common sources of qualitative data include:
- User interviews allow UX designers to explore users’ thoughts, feelings and motivations in detail. These conversations can uncover valuable insights into user needs, pain points and preferences that may not be evident from quantitative data alone.
- Usability testing involves observing users interacting with a product or service and noting difficulties or frustrations. This process helps designers identify usability issues, understand the context in which users interact with the product and make improvements based on their observations.
- Case studies and user stories provide real-world examples of how users interact with a product or service, offering valuable context and insights. By examining these narratives, designers can better understand the user’s perspective and create experiences that resonate.
Analyzing Data for Design
Analyzing data involves visualizing and interpreting the information, identifying patterns and trends, and extracting actionable insights to guide the design process.
Data visualization
Data visualization is transforming raw data into visual representations, such as charts, graphs and maps, to help designers more easily understand and interpret the information. Effective data visualization allows quicker identification of patterns, trends, and outliers. Tools like Tableau, Power BI and Google Data Studio can help designers create interactive and informative visualizations.
Identifying patterns and trends
Once data is collected and visualized, designers should carefully analyze the information to identify patterns and trends that inform the design process.
This may involve:
- Comparing data across different user segments (e.g., new vs. returning visitors, mobile vs. desktop users)
- Identifying correlations between user behavior and design elements (e.g., high bounce rates on specific pages, increased conversions after implementing a design change)
- Discovering the context in which users interact with their products and services, such as the time of day, location or device used.
Drawing actionable insights
The ultimate goal of collecting and analyzing data is to extract actionable insights that can guide the design process.
Designers should use the patterns and trends identified in the data to validate or refute their assumptions about user behavior and preferences. They can prioritize areas of improvement based on their impact on user experience and business objectives. And they can develop hypotheses for further testing and experimentation.
Implementing Data-Driven Design
Successfully implementing a data-driven design approach requires integrating data into every stage of the design process, using data to inform design decisions, committing to iterative improvements and measuring the impact of design changes.
Integrating data into the design process
To integrate data into the design process, designers should start by defining the goals and objectives of the project, including specific metrics to measure success.
Then, gather quantitative and qualitative data that aligns with the project’s goals and objectives. Use visualization tools and analysis techniques to identify patterns, trends and insights.
Finally, communicate data insights with the design team and other stakeholders to foster a data-driven culture within the organization.
Let’s say a UX team is working on a mobile app for a fitness company that helps users track their workouts and progress. Here’s how they can integrate data into their design process:
- Define goals and objectives: The UX team might aim to increase user engagement by 20% within the next three months by improving the app’s workout tracking feature and providing personalized workout recommendations based on user data.
- Gather data: The team can gather data on users’ workout habits, such as their preferred types of exercises, target heart rate zones and fitness goals. This data can inform the personalized workout recommendations feature and help the team tailor the app to users’ specific needs. They can also gather user feedback through surveys, interviews and usability testing to identify pain points and areas for improvement. This feedback can provide valuable insights into how users perceive the app and what features they would like to see.
- Analyze data: The team can use data analysis tools to identify patterns and trends in the data. For example, they may find that users who prefer high-intensity workouts tend to log onto the app more frequently or those who set specific fitness goals tend to use the progress tracking feature more often.
- Communicate data insights: The team should identify the stakeholders most impacted by the insights, such as product managers, developers, and executives. Based on the insights gained from the data analysis, the team should provide recommendations for improving the app’s design and features. They should align these recommendations with the business goals and objectives.
Business Strategy & Design can equip you with the skills to recognize the metrics that matter most to your stakeholders and how your design output can influence them.
Iterative design and continuous improvement
A data-driven design approach emphasizes the importance of iterative improvements and ongoing refinements.
Designers should test design variations using A/B testing to identify the most effective solutions. They should also continuously monitor user behavior and feedback, adapting the design to address evolving needs and preferences.
Measuring the impact of design
To evaluate the success of a data-driven design approach, designers should measure the impact of design changes on user experience and business outcomes.
This can be accomplished by:
- Establishing key performance indicators (KPIs) that align with the project’s goals and objectives.
- Monitoring changes in user behavior, engagement and satisfaction following design updates.
- Quantifying the impact of design changes on business outcomes, such as conversion rates, customer retention and revenue.
![]()
Challenges and Pitfalls in Data-Driven Design
While data-driven design offers numerous benefits, it also presents certain challenges and pitfalls that organizations must be aware of and address.
These challenges include overreliance on data, analysis paralysis, misinterpreting data, drawing false conclusions, and maintaining user privacy and ethical considerations.
Overreliance on data
Relying too heavily on data can lead to a lack of creativity and stifle innovation. Data should inform design decisions but not dictate them. Designers should balance data-driven insights with intuition, empathy and creative problem-solving to create well-rounded and effective user experiences.
Analysis paralysis
With the vast amount of data available, designers may be overwhelmed by the sheer volume of information, leading to analysis paralysis.
To avoid this pitfall, organizations should:
- Prioritize the most relevant data points and metrics that align with the project’s objectives
- Focus on actionable insights that can drive meaningful improvements in the design
- Encourage a mindset of iterative learning and improvement rather than striving for perfection from the outset
Misinterpreting data and false conclusions
Misinterpreting data or drawing false conclusions can lead to poor design decisions. It helps minimize risk when data professionals and designers collaborate to interpret data accurately.
Consider providing training and resources to assist team members in developing robust data analysis and interpretation skills. Encourage open dialogue and peer review of data interpretations, enabling team members to learn from one another and identify potential errors before they impact the design process.
Maintaining user privacy and ethical considerations
Collecting and using data for design purposes raises serious privacy and ethical concerns.
Organizations should take the following steps to ensure responsible data usage:
- Implement robust data privacy policies and practices, including obtaining user consent and anonymizing data when necessary
- Regularly review and update data collection and usage practices to comply with applicable privacy regulations and industry standards
- Foster a culture of transparency and accountability, ensuring all team members understand their responsibilities regarding data privacy and ethical considerations
Building a Data-Driven Design Culture
Organizations looking to harness the power of data-driven design must cultivate a vibrant, collaborative culture that marries experimentation, a shared understanding of data and a strong partnership between designers and data analysts. By doing so, they can create an environment that encourages learning, fosters creativity and facilitates effective communication.
For instance, designers can invite data analysts to design meetings and brainstorming sessions, ensuring their insights are woven into the creative process. By developing a basic understanding of data analysis themselves, designers can further strengthen this relationship and foster a common language around data.
In essence, a holistic approach to design is key. By blending data-driven insights with creative problem-solving and empathy for users, organizations can foster a dynamic and engaging design culture that effectively addresses user needs and drives growth.
Elevate Your Strategic Impact as a Designer with Business Strategy & Design
Are you a designer seeking to confidently contribute to strategy conversations and demonstrate the value of design in achieving business objectives? Our Business Strategy & Design course, designed by experts for designers like you, is here to help you align user-centered work with business goals, measure and communicate design’s strategic impact and strengthen cross-functional partnerships.