
In a volatile, uncertain, complex, and ambiguous (VUCA) economy, product managers are challenged with developing their product lines and solving unresolved market problems with innovative solutions that drive bottom-line results. They also must help build the infrastructure that generates top-line value and fosters competitive value.
Given the pace of economic and technological change, it’s crucial for product leaders to understand and report on performance drivers such as price, volume, fixed variable costs, and investments that stimulate both profitability and enterprise value. To do this effectively, you must leverage data analysis tools and take a data-driven approach.
Unfortunately, a company’s consolidated financial statement fails to reveal the profound variables of profit within the business. From the transaction level through vendor/product family, customer, sales territory, brand, and customer group, there are substantial variances in net profitability that tend to be obscured by revenue and gross margin statistics. Each business’s definitive net income is a result of the tension among three distinct groups of customers and products
- Profit makers: products and customers that increase peak internal profitability
- Profit neutrals: products and customers that either maintain or match peak internal profitability
- Profit takers: products and customers that reduce peak internal profitability
The dynamics of these three groups and the effort to understand and influence each determine the actual net profit of the business—its enterprise value and ability to target and manage profitable product growth. By remediating profit takers, improving profit neutrals, and growing profit-makers, the company can point its resources toward optimal, profitable growth. Also, because two customers of the same gross margin can consume organizational resources at different rates, a deeper analysis is crucial for understanding the true profitability of your products.
Regrettably, most product managers don’t know where products or customers fall among these categories. Thus, they fail to identify and mitigate profit takers, effectively reducing net income and enterprise value. Additionally, they often fall short in working with and focusing sales and support teams on the segments that drive profitable growth and market leadership.
Interestingly, many executives believe that their largest customers and product categories are their most profitable. However, this frequently is not the case. When the true cost to serve (CTS) is appropriately attributed, sizeable customers and categories are found across all three profitability groups.
Problems with Identifying Product or Customer Profitability
Revenue and gross margin are inadequate for identifying individual product or customer profitability. Today’s macro income statements do not calculate profitability at a granular level. True profitability analysis (TPA) has become a critical tool that product management leaders can implement to help executives, managers, and sales identify their profitable, neutral, and unprofitable products and clients. The TPA further highlights the drivers that produce these outcomes.
To analyze the drivers of net income, it’s important to calculate—at the line-item level—the volumes, prices, and cost of goods sold. This leads to gross margin and sums to gross profit. But, to arrive at net income, we must assign the variable, semi-fixed, and fixed CTS of invoice line items based on the products and customers served. Activity-based costing (ABC) establishes the real cost assigned to individual invoice transactions for a given time.
The CTS of products or customers results from a combination of inherent factors (rather than behavioral choices), the resulting support costs they incur, and the company’s decisions about the efficiency and cost of performing those activities. Product or customer factors (e.g., a product’s sourcing and delivery costs) tend to be fixed or stable over time. In contrast, behaviors tend to be affected by a vendor or client’s operational choices. CTS is a function of how your company chooses to perform activities, such as automation versus human labor or online ordering versus call centers. Again, CTS is a function of factors, vendor/customer operations plus internal choices, factors, and efficiencies.
Along with assigning operational costs, it also is crucial to identify the nature of such costs—fixed, semi-fixed, or variable. Over short or medium terms, fixed costs do not change proportionally as a function of broad changes in volume. Semi-fixed costs vary when specific step-level volume changes are triggered. Finally, variable costs change quickly and proportionally to sales volume. Understanding operating costs at this level allows executives and staff to determine if it is possible to remediate underperforming market segments and restructure operations to achieve greater efficiencies, as well as decide whether (and how) to serve, expand, shed or restructure market segments, customers and product offerings.
Using the Whale Curve to Maximize Profitable Growth and Enterprise Value
Pareto’s Principle, also known as the 80/20 rule, defines the tendency in large, fragmented data sets for the top 20% of the data points to contribute 80% of value outcomes and the bottom 80% of data points to contribute just 20% of value outcomes. This principle is a popular way of understanding opportunities to simplify, prioritize and exploit advantages.
Nonetheless, when it comes to customer and product profitability, the Pareto Principle broadly fails to account for the true underlying economic levers in business. Each business has its own characteristics. Within a company, segments and territories will have their divergent properties and ratios.
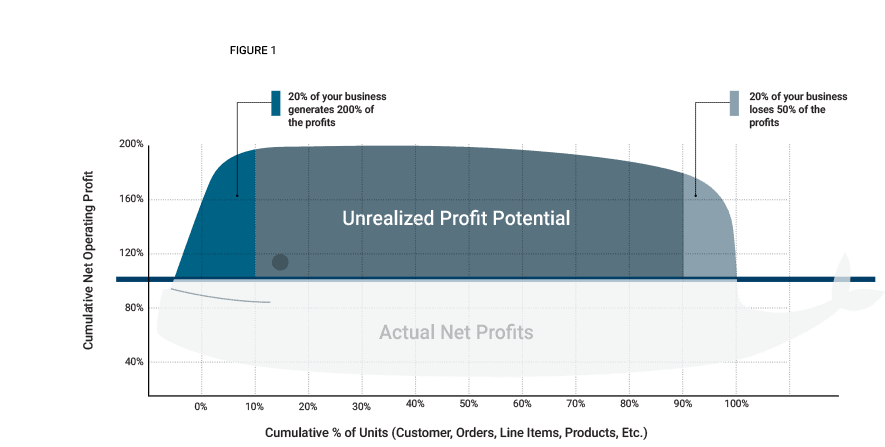
Once operating costs are assigned to individual customers and products, the results can be illustrated in a graphic depicting, in descending order, the net profit of all customers and products. The resulting chart, often called the whale curve because of its resemblance to a whale breaching, allows decision-makers to see the profit makers, neutrals and takers, their constituent members, and the effect they have in determining peak internal profit versus net profit. (See Figure 1.)

In a whale curve, customers or products are ranked by profitability, from highest to lowest. The X-axis plots customers or products while the Y-axis reflects accumulated profit. For most businesses, the whale ratio (the range of peak internal profit to net profit) ranges from 1.5 to 3. Within a smaller sample (e.g., a sales territory), the ranges can be substantially higher. The data also can be presented to focus on either profit makers or profit takers.
Once the whale curve is graphed, share it with executives and sales teams. Starting on the right side of the curve—the profit takers—your internal team has several choices to cut the whale’s tale
- Raise the product price
- Ask for cost support from the vendor
- Sell more products and services (the increased spend amortizes the margin across the total sale)
- Lower the cost of sale by using the inside sales reps
- Lower the cost of sale by assigning this account to an inside sales team
- Lower the cost of sale by having the customer order electronically
- Work with production to lower the cost to manufacture
- Work with sales to lower the cost to serve
Businesses also should focus attention on the profit makers to identify and create plans to grow and replicate them.
Generally, in whale curve economics, the top 20% of clients tend to be clear profit makers, contributing between 150% and 300% of net profits. The middle 60% tend to be profit neutrals and the bottom 20% tend to be profit takers, destroying from 50% to 67% of your peak internal profit to arrive at the final net profit level. Remember this critical insight by calling it the 20/300 rule or the 20/67 rule. Most importantly, though, is to remember this and act on it.

For a business with $1 million of net profit, it is likely that its peak internal profit—before taking on profit takers that reduced net profit—was $1.5 million to $3 million. If the company had identified and remediated or discharged its profit takers, the potential net profit could have been 50% to 200% higher than the actual net profit. Most notably, the company would be prosperous without adding customers or suppliers, raising quotas, or opening new operations. It would be managing its book of business for profitable growth as well as setting itself up to become a strategic market maker instead of an indiscriminate order taker.
For any complex business, the overall whale ratio and its distribution and variability become a critical operational set of metrics to identify where and how to remediate underlying drivers. It also guides the restructuring of business cost structures and growth targets and provides a way to align organizational resources to maximize profitable growth.
Learn More:
Find these related resources on PragmaticInstitute.com
Podcasts