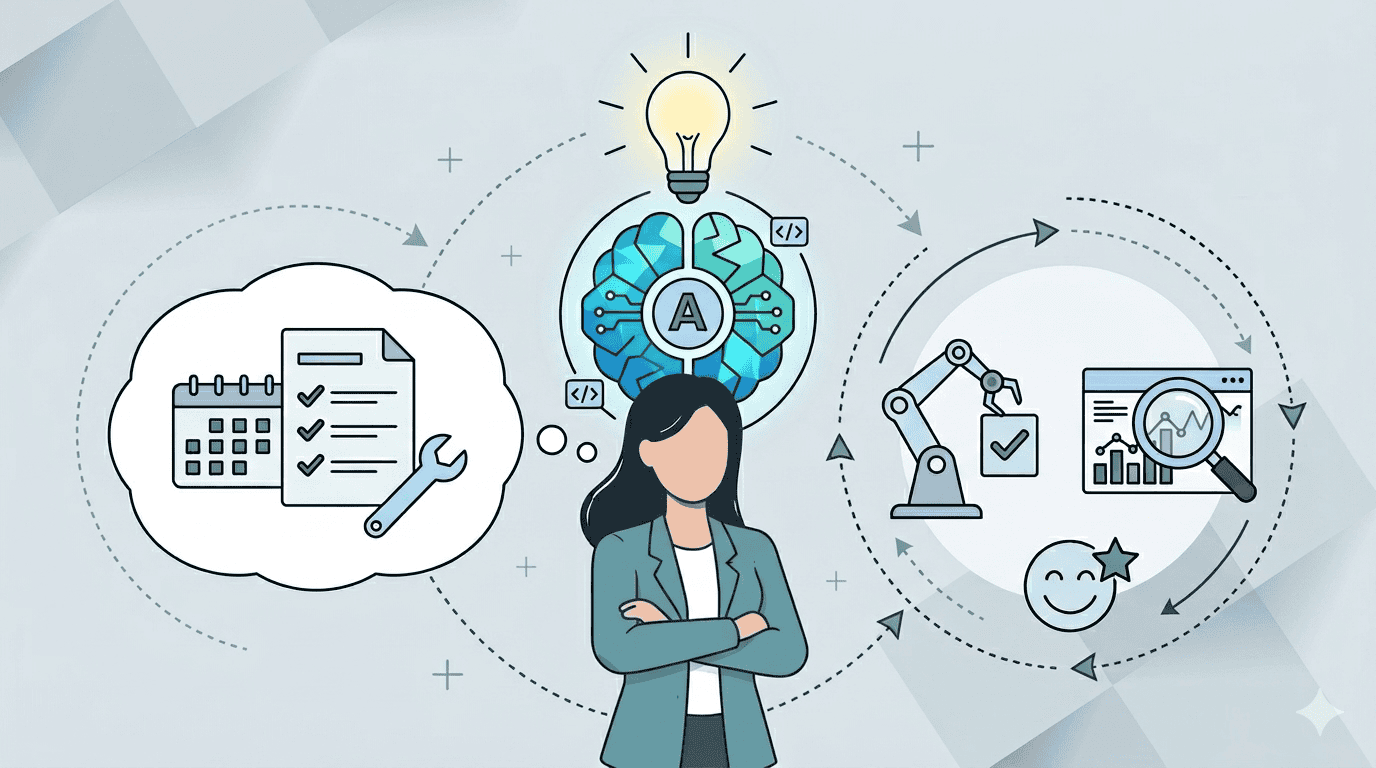
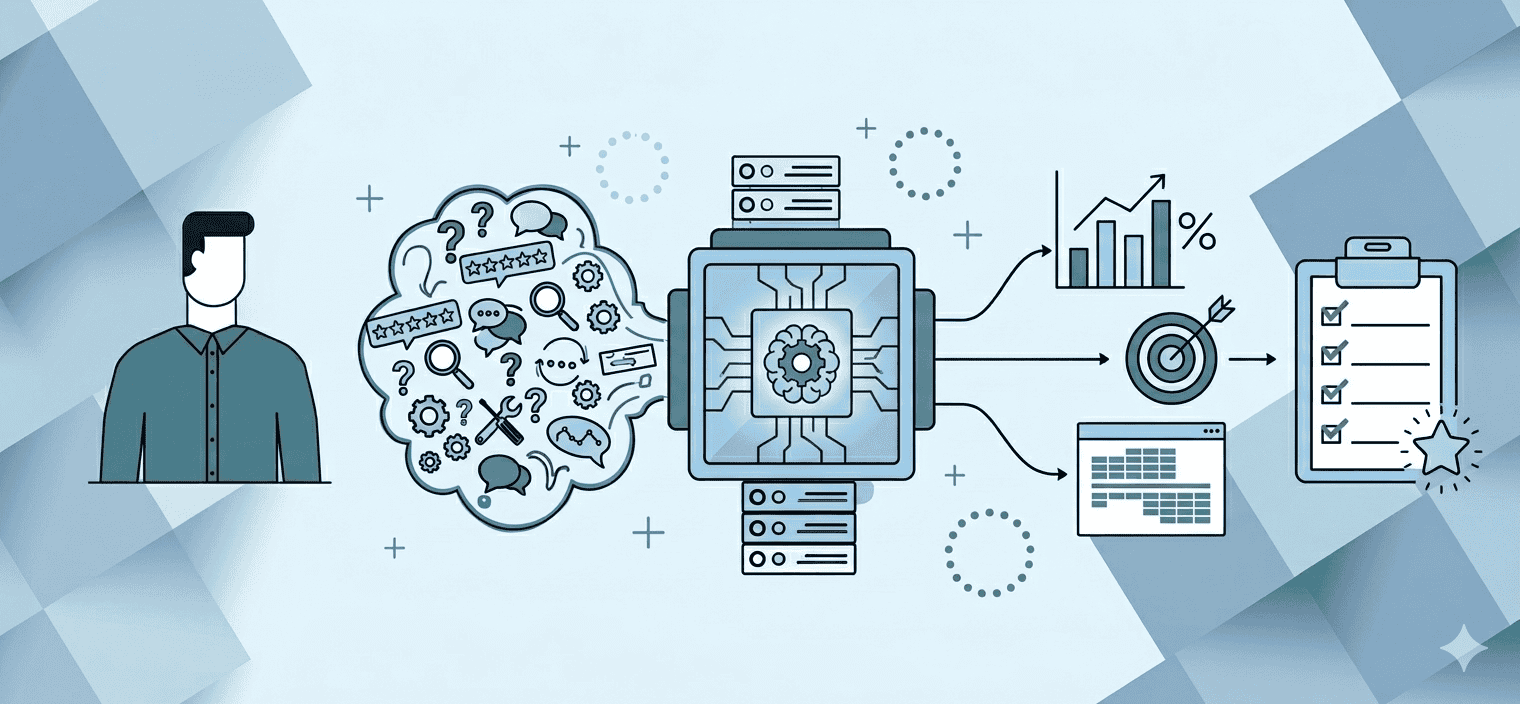
Resources

Refine by Type
Refine by Topic
Refine by Tag

Listen to Product Chats on

Infographic

How to Calculate Net Revenue Retention

Net Revenue Retention is a metric that helps you identify if your company is losing revenue from contractions in the existing customer base or if you have engaged customers who are spending more money over...
Category: Uncategorized
Infographic

Pocket Tools for Product Professionals

We understand that as a product professional, you have a lot to keep in mind. That’s why we’ve created a downloadable PDF that includes four essential tools that you can keep in your pocket, ready...
Infographic

Ode to the Positioning Document

This Pragmatic Institute Resource has been archived.
Category: Archive
Infographic

7 Steps for Launching a Win-Loss Program

“Why did I lose?” It’s the first question a salesperson wants to ask a prospect after failing to win their business. Unfortunately, it’s unlikely the prospect will answer the question candidly leaving your team with...
Infographic

Core Competency vs Distinctive Competency vs Competitive Advantage

The terms core competency, distinctive competency and competitive advantage are often used interchangeably (and incorrectly). To help, we’ve designed a quick cheat sheet to explain the differences and similarities for these important concepts.
Infographic

Salary Trends by Region

We’ve recently published the 20th Annual Pragmatic Institute Survey, and the data that always captures the most attention is salary trends. Since pay scales can fluctuate based on geography, this year we’ve divided this information...

Sign up to stay up to date on the latest industry best practices.

Sign up to received invites to upcoming webinars, updates on our recent podcast episodes and the latest on industry best practices.

Subscribe

Subscribe