When you’re getting started with data, the goal is to develop wisdom and apply it to make better decisions.
The DIKW Pyramid is a popular way to understand the process of extracting value from data. It stands for data, information, knowledge and wisdom. Each step up the pyramid leads toward a more lofty objective. At the peak is wisdom.
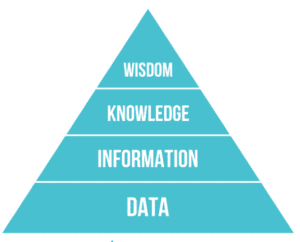
This pyramid gives us a visual answer to the question, “How do you process data to get to a place where you can have an ‘aha moment’?”
Intuition and Market Experience Still Matter
There is a common misconception that data replaces our intuition and experience. That’s not accurate.
There is value in combining analytical approaches and intuitive approaches. Experience is valuable even in data work. While intuition isn’t perfect, it is helpful and, more importantly, can help uncover issues with data—which isn’t perfect either.
When you observe things or talk to people, this is a perfect opportunity to form hypotheses. When you get the data, it’s a chance to test those hypotheses. They are two engines firing, and they work well together.
It’s a virtuous cycle where you grow in wisdom along the way.
This process may sound easy and obvious, but there are many pitfalls we have to avoid.
Pitfall #1: Data-Reality Gap
The data we’re working with isn’t a perfect reflection of reality. We sometimes forget that and assume the data is objective and unbiased. As a result, we don’t challenge it.
We go along with these tables and numbers, but every measurement system has various sources of noise and error. Processing data can be a tricky thing, and it can lead to all sorts of inconsistencies and inaccuracies.
There is a little bridge in Seattle next to the Tableau offices with bicycle counters. During a presentation, I connected to this data set, and together, we made a simple line chart of the number of bicycles crossing the bridge.
We saw this massive spike in data. It was like twice as many bicycles on a specific day. It was not hard to notice. So, the group started talking about what could have resulted in an outlier this significant.
Here are some of the hypotheses:
- There was a race on that date
- It was a “take your bike to work” day
- Maybe there was a tournament somewhere nearby
A little later in the presentation, someone raised their hand and said, “I found out why there was a spike in the data.”
They told us there was a problem with the batteries in the bicycle counters causing them to overcount. A bicycle blogger published an email conversation with the Department of Transportation explaining the issue to get it fixed.
At that moment, what became clear was out of all the hypotheses, no one mused that the data spike could have been an inaccurate reflection of reality. In this case, broken sensors.
Pitfall #2: Data Visualization Failure
Another big data blunder will happen when people make a chart to communicate their collected data. Intentional or not, the data visualization may be misleading or confusing.
A classic example is when pie charts are used to show data when the collection method was a form that said: “select all that apply.” Then, all the pie chart slices added together could represent more than 100%.
It’s not always the case, but many people learn to read left to right. These people typically assume that a left-to-right line is progressing forward in time.
As an example of misleading data visualization, I presented a line chart on the news to my students that showed the trend of Asian American hate crimes in Seattle. The data started with 2020 on the left and proceeded backward in time—2019, 2018, 2017…
I asked, “Is crime going up or down?”
They said, “down.”
It was going up, but the line was flipped.
This problem is so prominent that a website called Junk Charts gives numerous examples of visualization failures.
Pitfall #3: Data Processing Errors
We can have a perfectly compliant bar chart for which all the visual data experts will give their thumbs up.
But maybe it’s made with entirely incorrect data or joined with another table using the wrong kind of criteria.
It’s just dizzying when you think of how many problems could have happened before the point where I’m making and sharing a chart. This is what I layer into the book Avoiding Data Pitfalls. I try to find some of the ways we make analytical blunders and technical mistakes in how we work with data. It’s a minefield, and it can be overwhelming for people.
What is most important is that we recognize these errors as a part of the process. We need to keep going forward, learning and sharing what we did right and what we did wrong.
To improve your approach to data processing, it’s best to explore the contours of data:
- Look at the max and min
- Define the meaning of a row or attribute
- Understand the shape of the distribution
This exercise will help you notice an egregious problem in the data pretty early in the process.
Take time and observe what is there. Focus on it. Scan it.
Even if you contract out the data work or you’re not a part of the leading team working on analysis, you can come to the table with questions that can help prevent processing errors. Simple questions like, what is the data source? It is important not to shy away from asking for clarity. Data analysis should be a conversation.
The content of this article is based on a conversation published on the Data Chats podcast.
>> Listen to the Full Conversation
Additional Resources
For more data pitfalls, read Ben Jones’s book, Data Avoiding Data Pitfalls: How to Steer Clear of Common Blunders When Working with Data and Presenting Analysis and Visualizations available on Amazon.
* * *
Explore Pragmatic Institute’s Data Courses where you’ll engage in hands-on practice and learn a business-oriented approach, so you can better solve problems and propel decision making with data.
Data Science for Business Leaders: Learn how to partner with data professionals to uncover business value, make informed decisions and solve problems.
Business-Driven Data Analysis: Discover a proven, repeatable approach that you can leverage across data projects and toolsets to deliver timely data analysis with actionable insights.